When it comes to investments, ‘returns‘ is what matters to all of us. Mutual fund investments are no different. Be it an Advisor or a DIY investor, one of the main parameters that is often used to short-list’ right and best’ mutual fund schemes is the ‘past performance‘ of the MFs.
Besides looking at the past performance of a Mutual Fund scheme, we also try to compare its performance vis-a-vis with its Peers (schemes from same fund category/have similar investment profile), its Benchmark index and also with the average returns generated by its respective Fund category.
(A benchmark is a standard against which the performance of a security, mutual fund or investment manager can be measured. )
Let’s take an example, SBI Bluechip Fund (Large-cap oriented fund).
- Fund Vs Peers – Performance comparison
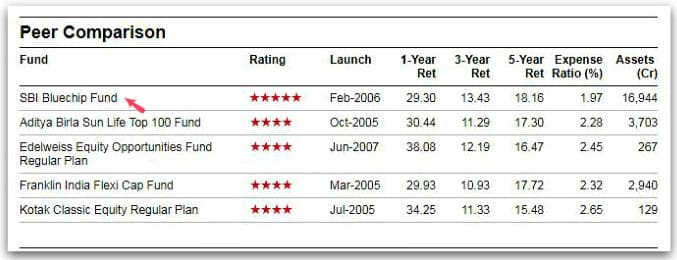
(Source : Valueresearchonline.com)
- Fund Vs its Bench-mark Vs Avg Category Returns
- The bench-mark index of SBI Bluechip Fund is S&P BSE 100.

- The bench-mark index of SBI Bluechip Fund is S&P BSE 100.
How to find out which is the benchmark index of a Mutual Fund Scheme?
You may kindly visit moneycontrol.com mutual fund section. You may perform ‘search’ for the concerned MF scheme. Click on ‘Overview’ section under ‘Investment info’ of a MF Scheme.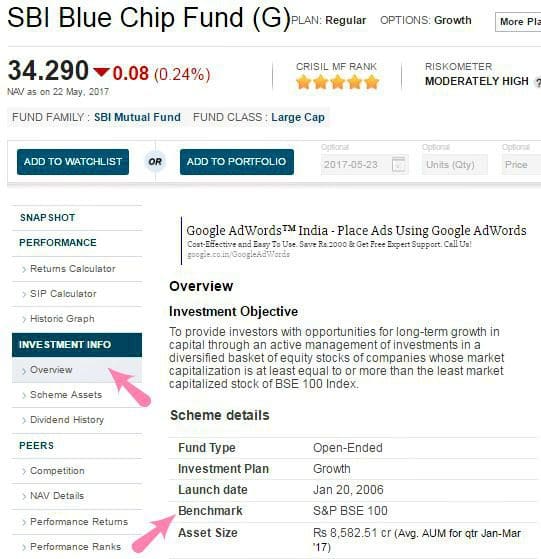
Let’s get to the main topic now i.e., Total Return Index.
As shown in the above images, a mutual fund scheme’s performance can be compared against the performance of its respective Benchmark index. As of now, the benchmark returns are calculated on the basis of ‘Price Return Index‘ (PRI).
- What is PRI? – A price return index considers price movements (capital gains or losses) of all the securities (stocks/bonds) that make up the index.
In our example – SBI bluechip Scheme’s fund manager picks the stocks that are primarily part of S&P BSE 100 index. He/she may or may not invest in all the Top 100 stocks (by market capitilization). But, the portfolio of SBI Bluechip fund can be similar to BSE 100 index.
As of now, most of the Mutual fund houses (except DSP Blackrock) use PRI to compare the schemes performance (espcecially Equity funds) with their respective benchmark indices.
But, with effective from 1st February – 2018, SEBI has ordered all the MFs to use ‘Total Return Index’ to benchmark the MF schemes performances.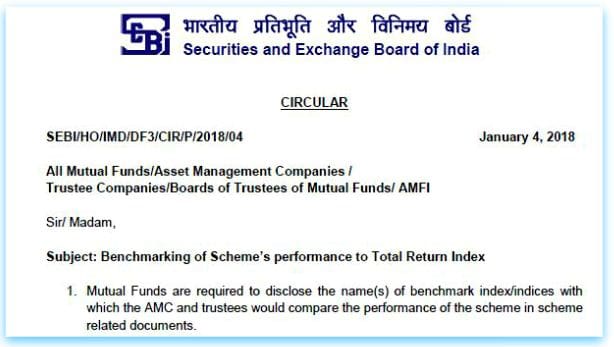
(Click on the above image to download SEBI’s circular on Total Return Index)
What is Total Return Index?
A total return index is an index that measures the performance of an Index (Benchmark) by assuming that all cash distributions are reinvested, in addition to tracking the components’ price movements.
A total return index (TRI) is different from a price return index. A price index only considers price movements (capital gains or losses) of the securities that make up the index, while a total return index includes dividends, interest, rights offerings and other distributions realized over a given period of time.
A price index does not consider the returns arising from dividend receipts. Only capital gains arising due to price movements of constituent stocks are indicated in a price index. Therefore, to get a true picture of returns, the dividends received from the constituent stocks also need to be factored in the index values. Such an index, which includes the dividends received, is called the Total Returns Index.
Looking at an index’s total return is usually considered a more accurate measure of performance. Hence, TRI can be more appropriate as a benchmark to compare the performance of mutual fund schemes.
As per the SEBI, the new norms are ;
- The performance of the schemes of a mutual fund shall be benchmarked to the Total Return variant of the Index chosen as a benchmark w.e.f 1st Feb, 2018.
- Selection of a benchmark for the scheme of a mutual fund shall be in alignment with the investment objective, asset allocation pattern and investment strategy of the scheme.
- Mutual funds shall use a composite CAGR figure of the performance of the PRI benchmark (till the date from which TRI is available) and the TRI (subsequently) to compare the performance of their scheme, in case TRI is not available for that particular period(s). The calculation of a composite benchmark performance return in CAGR terms would be as given below:

- The calculation of composite CAGR is elaborated with an example as below;
- For instance, ABC scheme had been launched on August 2, 1995. The benchmark PRI values are available from the date of inception of the fund. The benchmark TRI values are available from June 30, 1999.

- Thus, in the above example (for advertisements in the month of December, 2017 the last of the preceding month would be November 30, 2017), CAGR of Benchmark index would be 12.20%, since inception.[(1187.70/1007.57)*(13966.58/1256.38) ^ (1/22.3452)]-1
- How did we get 12.20%? – The benchmark index value as per PRI (when TRI data is not available) is 1007.57 points. The value of this index in TRI terms as in Nov, 2017 is 13966.58 points. The CAGR comes around 12.20%.
- So, a fund house has to use this ‘consolidated CAGR benchmark return’ in their advertisements and compare it with the Scheme’s performance.
- For instance, ABC scheme had been launched on August 2, 1995. The benchmark PRI values are available from the date of inception of the fund. The benchmark TRI values are available from June 30, 1999.
Price Return Index Vs Total Return Index
If we take the benchmark index that we are discussing i.e., S&P BSE 100;
- The CAGR returns of S&P BSE 100 for the last 5 year period is around 14.5%, if we consider Price Return variant of the Index.
- However, if take Total Return Index as the basis, the consolidated CAGR of S&P BSE 100 index comes to around 16%. (Data based on 31-Aug-2017)
- You can observe that TRI returns are higher than PRI returns, as the TRI takes into account all dividends/interest payments. Hence, TRI is more appropriate as a benchmark to compare the performance of mutual fund schemes.
“The number of Large-cap Equity mutual funds beating their benchmarks dropped to 58% from 85% after making a comparison on TRI rather than on Price Return Index basis” – Morningstar.in
For investors, the TRI would give the actual picture of what exactly he or she earns from a mutual fund investment vis-a-vis its benchmark. From the standpoint of fund managers, it will make them work a little harder to make the right stock pick.
As a MF investor in actively managed funds, I would obviously expect funds in my portfolio beat category average returns and Benchmark index (be it be TRI or PRI variant) as well, consistently.
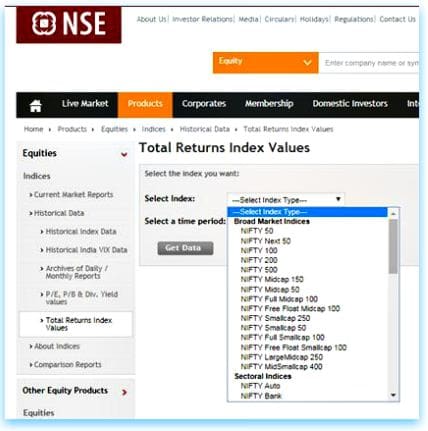
In case, you would like to get the Total Return Index values of all available Nifty Indices, you can find them on NSEIndia Portal.
Continue reading :
- What is 200 Day Moving Average? | How to track DMAs? How to use them in Mutual Fund investment decisions?
- How to select the right and best Mutual Fund Scheme based on the Measures of Volatility?
- What are Index Funds? ETFs Vs Index Funds | Should you invest in them?
(References : Valueresearchonline, moneycontrol, morningstar, SEBI circular & TheEconomicTimes) (Image courtesy of Stuart Miles at FreeDigitalPhotos.net) (Post published on : 05-January-2018)
Join our channels


Hello Sreekanth,
I like your blogs.I have a query Can I stop investing and just hold the past units in my mutual funds(SIP)?
Thanks,
Vaskar
Dear Vaskar ..Yes, you can..
Hey Sreekanth , When TIR reflects a better picture and returns on paper , why ere the mF’s have not adopted it and stick to PRI. They would have got more investments if they would have shown TIR !
Dear Bharat,
It is a better tool from investor view point.
From the standpoint of fund managers, it will make them work a little harder to make the right stock pick. The difference between fund’s returns minus PRI can be higher, whereas the returns between fund’s minus TRI can be lower.
Got it..Thanks
Dear Sreekanth, let me start with saying great blog. I recently found your website and must say you have some great knowledge. It is a very kind service that you are doing. My questions are –
1. How is SBI Blue Chip Fund (G) fund?
I have started investing in SBI Blue Chip Fund (G) from last four months after a lot of research. My timeline is for next 10 years. What is your opinion on this fund? I am investing rupees 10,000/month in this fund.
2. Should I invest in Aditya Birla Sun Life Frontline Equity Fund (G)?
I want to invest another 10,000 per month with 20 years timeline then should I invest in more in SBI or in Aditya Birla Sun Life fund?
Thank you for your help.
Dear shivani,
Thank you for your appreciation and encouraging words!
1 – Kindly continue with your investments.
2 – As your investment time-frame is very long term, advisable to have a look at an Equity diversified fund (or) a mid/small cap fund.
Related articles :
How to pick right mutual fund scheme?
MF portfolio overlap analysis tools
Hi Sir first of all thanks for your informative articles because of which I started investing in mutual funds.
I’m thinking of investing in
HDFC balanced fund and
Mirae asset India opportunities fund
via sip 3000 each for 15 years for building corpus for my son’s education. He’s one year old.
Are the above funds ok if not please suggest any other alternative funds to reach my goal
Dear Sri Lakshmi.. You may kindly go ahead with your investment plan..these are good ones!
Related articles :
Kid’s education goal planning
List of important articles on Personal Financial Planning
Thank you for your kind response now I got the confidence to start those SIPs
Do I need to include any debt funds or bank rds in addition to the above SIPs
Dear Lakshmi,
As this is your long term goal, suggest you to invest as much as possible in equity funds for now (may be say for next 5 years or so).
Are you investing in other investment options?
Bank FDs/RDs can be avoided for long term..
Till now I have Vrd 45000 maturing next month and emergency fund 100000 in FD I want your suggestion for that Vrd amount
Dear Lakshmi ..May I know your investment objective(s) and time-frame for this?
Hi Sir that Vrd I started for my son’s education only time frame is 15 years
Dear Lakshmi,
You may divert this corpus into your existing mutual funds itself.
Related article : What is an Emergency Fund?
Thank you so much sir for your kind and patient responses
Currently How many funds are using TRI as benchmark. I know QLTE is the one kind of fund using it
Dear Vandhi,
I believe that DSP Balckrock has adopted TRI benchmarking for their Equity schemes.
Sreekanth,
I am investing in these mutual funds. Any suggestions for improvement?
Tata Retirement Savings Fund – Progressive Plan – Direct Plan
Mirae Asset India Opportunities Fund – Direct Plan
L&T India Value Fund – Direct Plan
Aditya Birla Sun Life Tax Plan – Direct Plan
Axis Long Term Equity Fund – Direct Plan
SBI Magnum Balanced Fund – Direct Plan
HDFC Balanced Fund – Direct Plan
Franklin India Smaller companies fund
Dear Arun,
Individually all listed ones are decent schemes.
May I know your investment horizon and objectives?
Kindly read:
MF portfolio overlap analysis tools
How to pick right mutual fund schemes?
Dear Sree,
I have been investing in these mutual funds via SIP
SBI blue chip 1000 pm,
Kotak Select focus 1000 pm,
ABSL Gennext 1000 pm,
ABSL small and mid cap 2000 pm.
I can stay invested for the next 20 years
Please let me know, whether I have chosen the right funds.
Dear Rajan,
The first two funds are fine.
I believe that there are better funds than ABSL Small/midcap fund in mid/small category.
ABSL gen next fund currently has around 65% allocation to large-cap oriented stocks. You have two funds SBI & Kotak with higher allocation to large cap stocks. So, may be you may discontinue this fund (Gennext) and pick up one Mid-cap fund / Diversified fund.
Kindly read:
How to select right mutual fund schemes?
MF Portfolio overlap analysis tools
Dear Sree,
Thank you for the valuable suggestions. At this juncture I would like to ask u what are the recommended Diversified & mid cap funds
Dear Rajan,
Given a choice, I would consider HDFC Mid-cap opportunities fund & Mirae emerging bluechip fund.
You may kindly compare the funds with their Risk ratios..
Thank u Sree for the valuable suggestion
Hi Sreekanth, I’m planning to invest in MF, as I’ve never invested in MF so I’m completely new for MF.
Goal :
1- Daughter’s Education / Marriage (She born in Nov 2017)
2- Retirement planning (my DOB is 1987) after 25 yrs in 2045 around ~1 Cr.
How much amount i need to invest monthly to meet both the goals and which fund would be good for lunch term.
Thank You as always !
Dear Chandresh,
Suggest you to kindly go through below articles :
Kid’s education goal planning
Retirement goal planning
List of Important articles on financial planning
Best investment options