The Reserve Bank of India (RBI) has released the latest volume of its annual statistical publication, ‘Handbook of Statistics on the Indian Economy – 2019′ on 15th Sep, 2019. Through this publication, the Reserve Bank has been providing time series data on various Economic and Financial indicators for the Indian economy.
You can find lot of useful data related to;
- Macro Economic indicators
- Money & Banking
- Financial Markets
- Public Finances
- Trade & Balance of payments
- Socio & Economic indicators and so on..
Based on this statistical data, I have been collating and publishing (since 2014) some important / interesting points and trends related to Personal Finances like – Financial Saving habits of Households, total investments in bank deposits, investments in shares & mutual funds, information on total bank loans, performance of Share markets, Inflation data, NRI deposits, Deposit & Lending interest rates pattern etc.,
Before discussing the facts & figures, let us understand – what are household savings, Financial Assets and Physical Assets?
Households’ Savings correspond to the total income saved by households during a certain period of time. Savings and investments in banks, stock markets, Post office schemes, company deposits etc., are considered as Financial Assets / Financial Savings. Investments in properties (real estate), gold, silver etc., are Physical Savings / Physical Assets.
Indian Household Investments, Savings & Liabilities Pattern 2019
Financial Assets Vs Physical Assets – Which are our preferred Assets?
- From 1990 to 2000, Indian households preferred to invest in Financial assets to Physical assets.
- From 2000 to 2007, more savings were routed to Physical assets.
- Interestingly in 2007/08, more investments were made in Financial assets. This shows that retails/small investors participated in stock markets when their valuations were at peak. The markets eventually crashed in 2008.
- From 2008 to till 2015, we preferred physical savings to financial savings.
- The Gross Savings of Household sector have seen a considerable increase to Rs 29,382 billion in 2017-18, from Rs 26,229 billion in 2016-17.
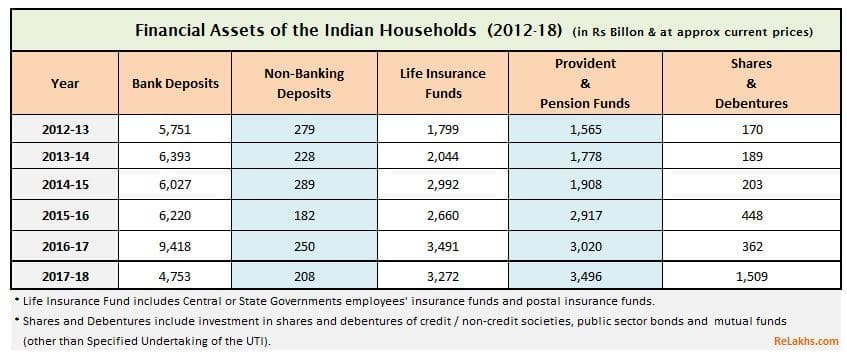
- The Gross Financial Savings during 2014-15, 2015-16, 2016-17 & 2017-18 were Rs 12,572 billion, Rs 14,962 billion, Rs 14,383 billion & Rs 18,695 billion.
- The savings in Physical Assets were around Rs 15,000, Rs 13,000 billion & Rs 16,000 billion during 2014-15, 2015-16 and 2016-17 respectively. The savings in Physical assets have seen a steep increase in 2017-18 to around Rs 17,600 billion.
- The above recent years data clearly indicates that there has been an uptick of savings in Physical Assets and Financial Assets in 2017-18 when compared to the figures of 2016-17. However, Financial Savings outscored savings in Physical Assets.
- Savings in the form of Gold and silver ornaments have seen a fall to Rs 412 billion in 2017-18 when compared to Rs 462 billion in 2016-17.
Financial Assets (Savings) of the Households (2012-2018)
Financial Liabilities of Indian Households (2018)
- The total Financial liabilities (loans & advances) of the Indian household sector were around Rs 7,405 billion in 2017-18.
- This figure was around Rs 4,686 billion for the FY 2016-17. So, the financial liabilities of Indian households have increased by almost 60%.
- Loans taken from Banks during 2015-16, 2016-17 & 2017-18 were Rs 2,747 billion, Rs 2,509 and Rs 4,300 billion respectively.
- The total Home loans outstanding with HDFC are around Rs 4,025 billion till 2018-19.
Bank Fixed Deposits Data
The below table gives you an idea about the total outstanding amount (as on Mar 2019) saved in Bank Term Deposits based and the tenure of the deposits. Term deposits with 1 to 2 year duration were the most preferred ones, followed by the Five year term deposits (these can be tax saving FDs).

Deposits by NRIs
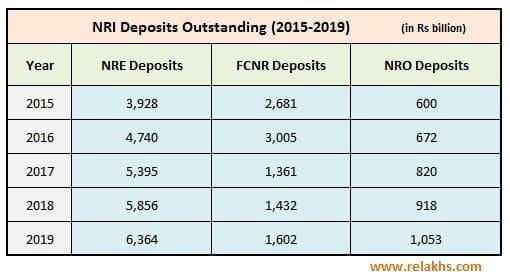
There has been a steady increase of outstanding deposits by NRIs in NRE & NRO accounts since 2015 to 2019.
Interest Rates pattern of Bank Deposits (2012 to 2019)
Below table gives us an idea about the deposit rates and lending rates pattern in India over the last 7 years.
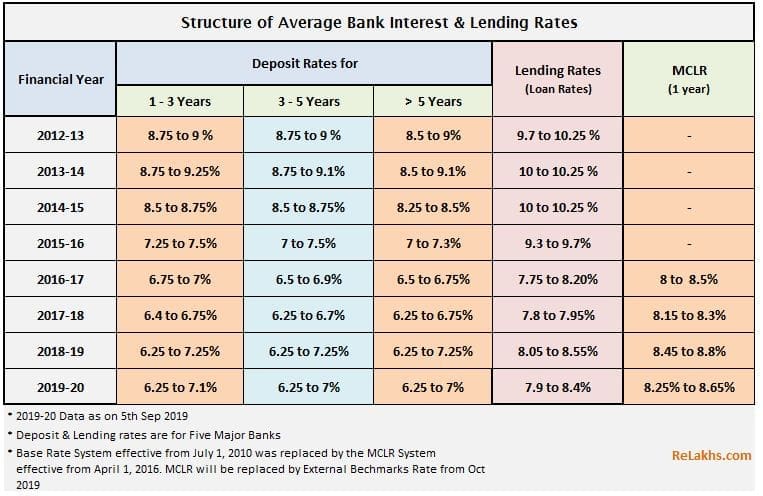
You can notice that deposit rates and lending rates have decreased in current FY 2019-20.
Related Article : External Benchmark Rates like Repo Linked Lending Rate (RLLR) will replace MCLR from Oct 2019.
Deposits in Post office Small Savings Schemes (SSS)
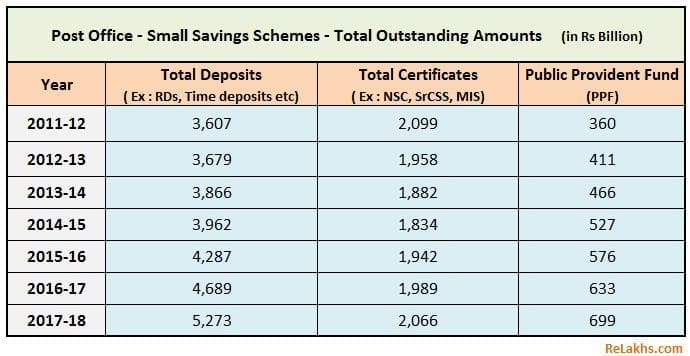
- Indian households’ savings in Post office time deposits and PPF have been increasing steadily since 2011.
- During 2012-16 there has been a decline in investments in NSCs, KVP certificates and other popular schemes like Senior Citizen Savings Schemes or Monthly Income Scheme (MIS), however this trend has been reversed during 2016-18.
Imports of Gold & Silver
- Savings in the form of Gold and silver ornaments have seen a fall to Rs 412 billion in 2017-18 when compared to Rs 462 billion in 2016-17.
- The average annual price of Gold (10 gms ; Prices @ Mumbai) in 2018-19 was Rs 31,193 and silver (1 kg) was Rs 38,404.
- Gold & silver to the tune of Rs 2,170 billion and Rs 207 billion were imported during FY 207-18.
- The figures for 2018-19 were, Rs 2,294 billion worth of Gold and Rs Rs 261 billion of Silver had been imported.
- We can notice that savings in Gold had decreased during 2016-17 but steadily picking up again during 2018-19.
Mutual Fund Schemes : Assets Under Management till 2019
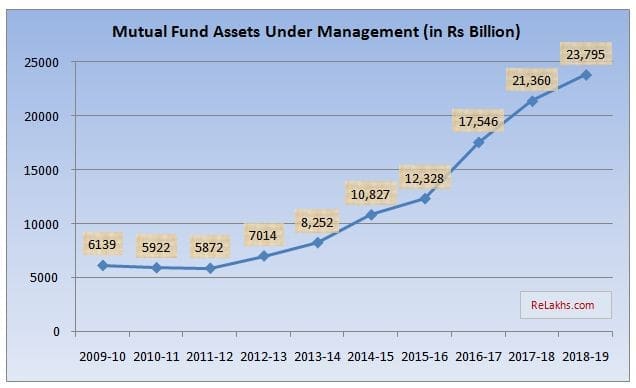
There has been around 11% increase in AUM of Mutual Funds in India during 2018-19.
Other important observations
- Inflation : The CPI (consumer Price Index), which is popularly known as INFLATION has gradually decreased from 10 in 2012-13 to 3.4 in 2018-19.
- Below Poverty Line : Around 29.8% of the population in India still lives below poverty line.
- Investments by LIC : LIC has invested around Rs 26,366 billion in Stock-exchange securities during 2018-19 (an increase of around 10%). During 2017-18, LIC had invested around Rs 24,154 billion.
- NBFC Deposits : The total outstanding public deposits with NBFCs were around Rs 304 billion and Rs 400 billion for 2017-18 and 2018-19 respectively. (Related article : ‘How to check if a Company can collect Deposits from the Public? – Company FD Schemes‘)
- An interesting observation is – the number of reporting NBFCs have declined from 168 to 81 during 2018-19.
- Income Tax Revenue Collection : The Central Govt had collected Personal income tax to the tune of Rs 3,582 billion during 2019, up from Rs 3,333 billion in 2018.
- Share Market Indices: The annual average of share price index of BSE Sensex was 32,396 and Nifty was 10,424 for FY 2017-18. The annual average of share price index of BSE Sensex was 35,971 and Nifty was 11,131 for FY 2018-19.
- CRR & Repo Rates : The RBI did fourth consecutive repo rate cut in August 2019, after the rate cuts in February, April & June of 2019. The latest rates as of 7th August, 2019 are – CRR @ 4%, SLR @ 18.75%, Repo rate @ 5.4% and Reverse-repo rate @ 5.15%. (Read : ‘What is CRR/SLR/Repo rate?‘)
- New Capital Issues : The non-gov Public Ltd companies raised around Rs 167 billion through Equity public issues during 2018-19. This figure was around Rs 679 billion in 2017-18. The total amount raised by the companies through the fresh issue of Debentures during 2018-19 Rs 366 billion. This figure was around Rs 49 billion only during 2017-18.
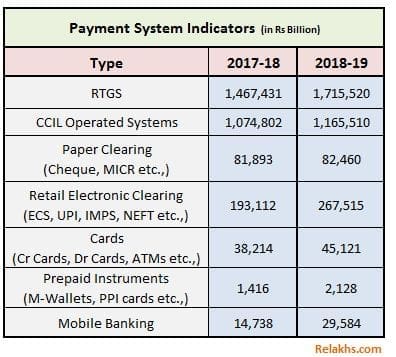
- Electronic Payment System : The FY 2018-19 saw a huge uptick in the amount of money cleared through retail electronic clearing systems and Mobil banking.
My opinion:
We (Indians) maintain a reasonably very high net savings rate (the national saving rate is about 20 per cent of GDP). Also, the Net Disposable Income has been increasing steadily.
However, the net savings rate growth as a % of GDP has been steadily declining since 2011-12. Moreover, a considerable percentage of income is still in the form of cash/currency, invested in low-yielding bank deposits and/or unproductive assets like Gold. This has to change.
There is a huge scope for channeling households savings into the financial markets, which is imperative.
I hope you find this post informative and useful. Where do you save and invest? Which are your preferred investment avenues? Kindly share your views and comments!
Continue reading :
- List of all Popular Investment Options in India – Features & Snapshot
- Lump sum Investment options for Retirees/Senior Citizens | Where to invest your Retiral benefits to get Regular Income?
(Reference : RBI’s Handbook of Statistics on the Indian Economy 2018-19. Some data is based on the preliminary estimates) (Post first published on : 17-Sep-2019)
Join our channels


Agreed, but financial market investments are subject to its own risks, also majority of tier B & C cities do not have much awareness & infrastructure required this to happen
As you wrote, it is imperative that there is is a huge scope for channeling households savings into the financial markets, it will take some time to happen because of the reasons mentioned above
Dear Sharad,
The infra has been improving tremendously in the last few years. Also, executing the financial transactions is at finger tips unlike the past where investors have to depend on the intermediaries via offline mode.
I agree with reference to ‘awareness’ part.
Thanks for sharing your views!