The Reserve Bank of India (RBI) has released the latest volume (27th edition) of its annual statistical publication, ‘Handbook of Statistics on the Indian Economy (2024-25) on 29th August 2025. Through this publication, the Reserve Bank has been providing key data on various Economic and Financial indicators for the Indian economy.
The handbook’s main purpose is to disseminate historical time-series data, allowing its readers to analyze latest trends and compare the performance of various financial and economic indicators over time. This data is very crucial for understanding changes in household savings rates and debt levels, which are key indicators of economic health.
Based on this statistical data, I have been collating and publishing (since 2014) some important / interesting points and trends related to Personal Finances like – Indian Household Savings Pattern, total investments in bank deposits, investments in shares & mutual funds, information on total bank loans, NRI deposits, Small Saving Schemes, Bank Deposit & Key Lending interest rates pattern and so on.
Indian Household Savings Pattern 2024-25
Households’ Savings correspond to the total income saved by households during a certain period of time. Savings and investments in banks, stock markets, Post office schemes, company deposits etc., are considered as Financial Assets / Financial Savings. Whereas, the investments in properties (real estate), gold, silver etc., are Physical Savings / Physical Assets.
Financial Assets Vs Physical Assets : Which are the preferred assets by Indian households?
- From 1990 to 2000, Indian households preferred to invest in Financial assets to Physical assets.
- From 2000 to 2007, more savings were routed to Physical assets.
- Interestingly in 2007/08, more investments were made in Financial assets. This shows that retail/small investors participated in stock markets when their valuations were at peak. The markets eventually crashed in 2008.
- From 2008 to till 2015, we preferred physical savings to financial savings.
- The Gross Domestic Savings of household sector have seen a considerable increase from Rs 38,44,582 crore in 2018-19 to Rs 54,61,259 crore in 2024.
- The below table gives us an idea about the gross financial savings during 2018-2024.
| Year | Gross Financial Savings (₹ crore) | Observations |
|---|---|---|
| 2018–19 | 22,63,690 | |
| 2019–20 | 23,24,563 | Increased from earlier estimates |
| 2020–21 | 30,67,021 | Financial Savings peaked due to the pandemic (Covid), as lockdowns limited consumption opportunities. |
| 2021–22 | 26,11,974 | Decline from the pandemic peak |
| 2022–23 | 29,27,604 | Recovering from the previous year’s dip |
| 2023–24 | 34,30,640 | While the total financial assets increased, it was paired with a surge in liabilities. This drove down Net Financial Savings. |
- The proportion of physical savings as a percentage of GDP declined steadily from 2012-16. The below table gives us an idea about the savings in Physical Assets during 2018-2024.
| Year | Physical Savings (₹ crore) | Observations |
|---|---|---|
| 2018–19 | 23,09,463 | |
| 2019–20 | 22,52,167 | A slight dip in physical savings |
| 2020–21 | 21,35,450 | Financial Savings peaked & Physical savings dropped drastically due to the pandemic (Covid) |
| 2021–22 | 29,68,302 | The trend reversed as the economy reopened. Households channeled their savings again into physical assets like real-estate & gold |
| 2022–23 | 36,14,851 | The trend reversal continued |
| 2023–24 | 38,44,515 | The shift towards physical assets continued. The share of physical savings was around 70% in 2023–24, compared to net financial savings at around 30% |
- The savings in the form of gold and silver ornaments have increased from Rs 42,673 crore in 2018-19 to Rs 65,104crore in 2024.
Financial Assets (Savings) of the Households (2014-2024)
Let us now understand how the households allocated their savings among different investment options;

- Equity and Investment Funds: The share of equity and investment funds have increased significantly from Rs 20, 364 cr in 2014 to Rs 2,76,070 cr in 2024.
- Deposits and Currency Holdings: The share of deposits and currency holdings has increased from the lows of 2021-22.
- Pension and Provident Funds: The share of pension and provident funds steadily increased and has been stable since FY20.
- Life Insurance : The investment in life insurance has reached multi-year highs during 2024.
- NBFC Deposits : There have been significant NBFC deposit withdrawals during 2023-24.
Bank Fixed Deposits & Maturity Pattern
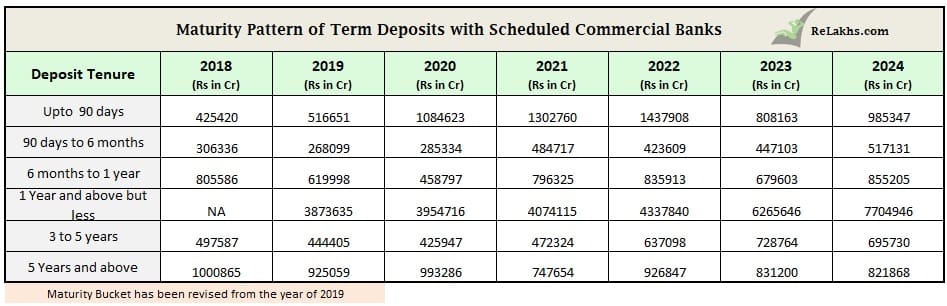
The above table gives us an idea about the total outstanding amount saved in Bank Term Deposits based on the tenure of the deposits. Except Term deposits of 3 to 5 yeas and above 5 years duration, all other time deposits have shown a positive growth in 2024.
Bank Deposits by NRIs
Below are the outstanding NRI Bank Deposits (in crores) from 2015 to 2024;
| Year | NRE Deposits | FCNR Deposits | NRO Deposits |
|---|---|---|---|
| 2015 | 392832 | 268106 | 60059 |
| 2016 | 474068 | 300593 | 67294 |
| 2017 | 539544 | 136173 | 82033 |
| 2018 | 585625 | 143264 | 91848 |
| 2019 | 636491 | 160271 | 105390 |
| 2020 | 676338 | 181451 | 119521 |
| 2021 | 742720 | 148235 | 136428 |
| 2022 | 767881 | 128879 | 162281 |
| 2023 | 787776 | 159199 | 194842 |
| 2024 | 822264 | 214549 | 229459 |
Interest Rates pattern of Bank Deposits (2014 to 2024)
Below table gives us an idea about the deposit rates pattern in India over the last 10 years.
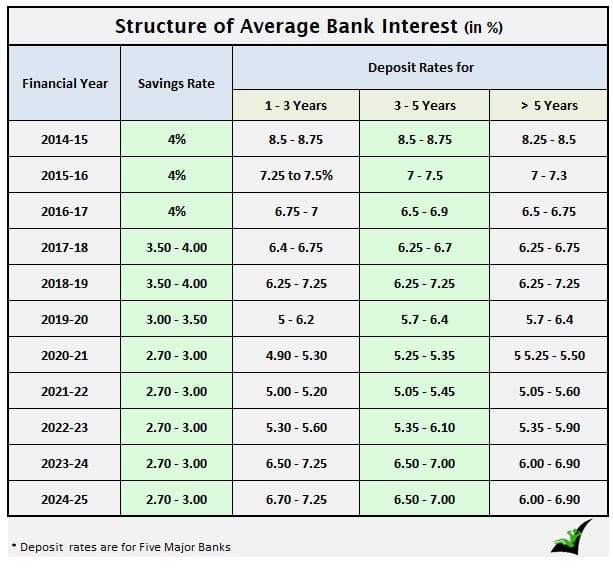
In early 2025, the RBI began an easing cycle, reducing the repo rate in a phased manner to stimulate economic growth and address easing inflation. As of August 2025, several banks have adjusted their fixed deposit (FD) interest rates downwards in line with the repo rate cuts.
Deposits in Post office Small Savings Schemes (SSS)
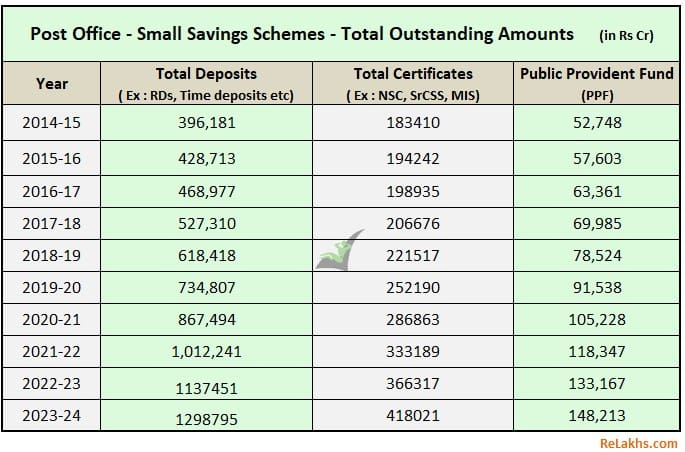
- Indian households’ savings in Post office time deposits and PPF have been increasing steadily since 2011.
- During 2012-16 there has been a decline in investments in NSCs, KVP certificates and other popular schemes like Senior Citizen Savings Schemes or Monthly Income Scheme (MIS), however this trend was reversed during 2016-18.
Mutual Fund Schemes : Assets Under Management (2014-2024)
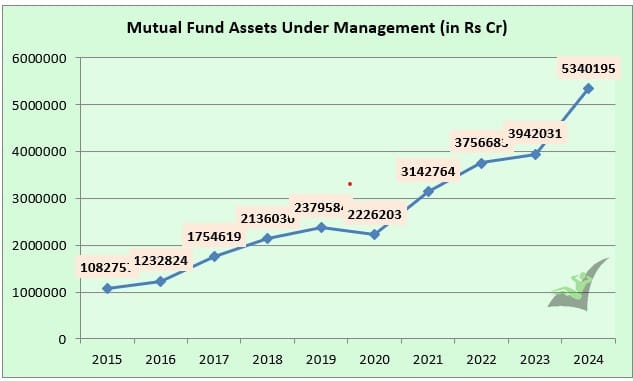
There has been around 7% decline in AUM of Mutual Funds in India during 2019-20 due to covid impact. However, the stock markets have recovered well and hence we can notice the study raise in the AUM of the mutual fund houses. In fact, there has been a 35% increase in AUM in 2024.
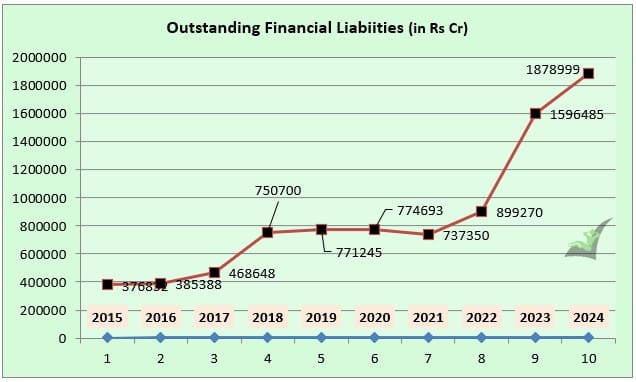
Financial Liabilities of Indian Households (2024)
- The total Financial liabilities (loans & advances) of the Indian household sector were around Rs 18,78,999 crore during 2023-24. This is a whopping increase of more than 200%. This figure was around Rs 8,99,270crore for the FY 2021-22.
- While the total financial assets during 2023-24 increased, it was paired with a surge in liabilities. This drove down the Net Financial Savings of Indian household.
Though the share of Gross financial savings and physical savings are almost equal, the surge in financial liabilities have drove down the net financial savings. The combination of declining financial savings and rising liabilities has led to a significant drop in net financial savings. Net financial savings, or the surplus after accounting for liabilities, declined by more than 30% from the pandemic peak.
Causes for concern – Increasing household debt burden and financial fragility, especially with rising unsecured loans. Challenges for the banking sector, as deposit growth lags credit growth.
In conclusion, while the share of financial and physical savings might appear balanced at a glance, the rise in financial liabilities has significantly eroded the net financial savings of Indian households, raising concerns about the long-term economic stability and investment capacity of the nation.
I hope you find this post informative and useful. Where do you save and invest? Which are your preferred investment avenues? What is your view on the increasing financial liabilities (loans) of Indian household?
(Post first published on : 02-Sep-2025)
Join our channels


in chart last ten years where did indian invest in last 10 years how can it be zero starting for shares and debentures.
Dear Anand – The share of equity and investment funds have increased significantly from Rs 20, 364 cr in 2014 to Rs 2,76,070 cr in 2024 (mentioned right below the chart).