When we buy a life insurance policy, most of us start by comparing companies on their Claim Settlement Ratio. Some of us also look at premium rates, bonuses, or how strong the brand feels.
But there’s one more metric that rarely gets discussed—the life insurance persistency ratio.
This ratio, published every year by IRDAI, shows how consistently policyholders keep paying their premiums after the first year. It shouldn’t be judged in isolation, but it does offer useful clues about how well an insurer retains customers over the long term.
In this article, I look at 10 years of official IRDAI persistency data (FY2015-16 to FY2024-25) to see how India’s leading life insurers have performed over time—and what you, as a prospective policyholder, can learn from those trends.
What is the Life Insurance Persistency Ratio?
The life insurance persistency ratio tells you what percentage of policyholders keep paying their renewal premiums after buying a policy.
In simple terms:
Higher persistency ratio = more customers continue their policies.
Regulators track this at different points in time to see how many policies remain active:
- 13th month: Customers who renewed their policy after the first year
- 25th month: Customers who continued after the second year
- 37th month: Customers who continued after the third year
- 49th month: Customers who continued after the fourth year
- 61st month: Customers who continued after the fifth year
As you move from the 13th to the 61st month, these ratios usually decline. That’s because some policyholders stop their policies along the way—due to affordability issues, changes in income, shifting financial priorities, or realizing the product doesn’t fit their needs anymore.
Why Should You Care About the Persistency Ratio?
Persistency Ratio deserves attention because it tells you something very different from the usual numbers like Claim Settlement Ratio.
A consistently higher persistency ratio can suggest that:
- Policyholders are actually sticking with their policies and paying premiums over the long term.
- The products are better aligned with customer needs and expectations.
- The ongoing premium commitment is broadly manageable for most customers.
- Customer retention has been relatively stronger over the years.
That said, a high persistency ratio does not automatically mean an insurer is “better”, and a lower ratio does not always mean poor performance. Product mix, customer profile, distribution model, and overall business strategy can all influence persistency—so it’s best used as one lens among many, not the only deciding factor.
10-Year Average Life Insurance Persistency Ratios (FY2015-16 to FY2024-25)
Rather than looking at a single year’s figures, I analyzed the last 10 years of official IRDAI data.
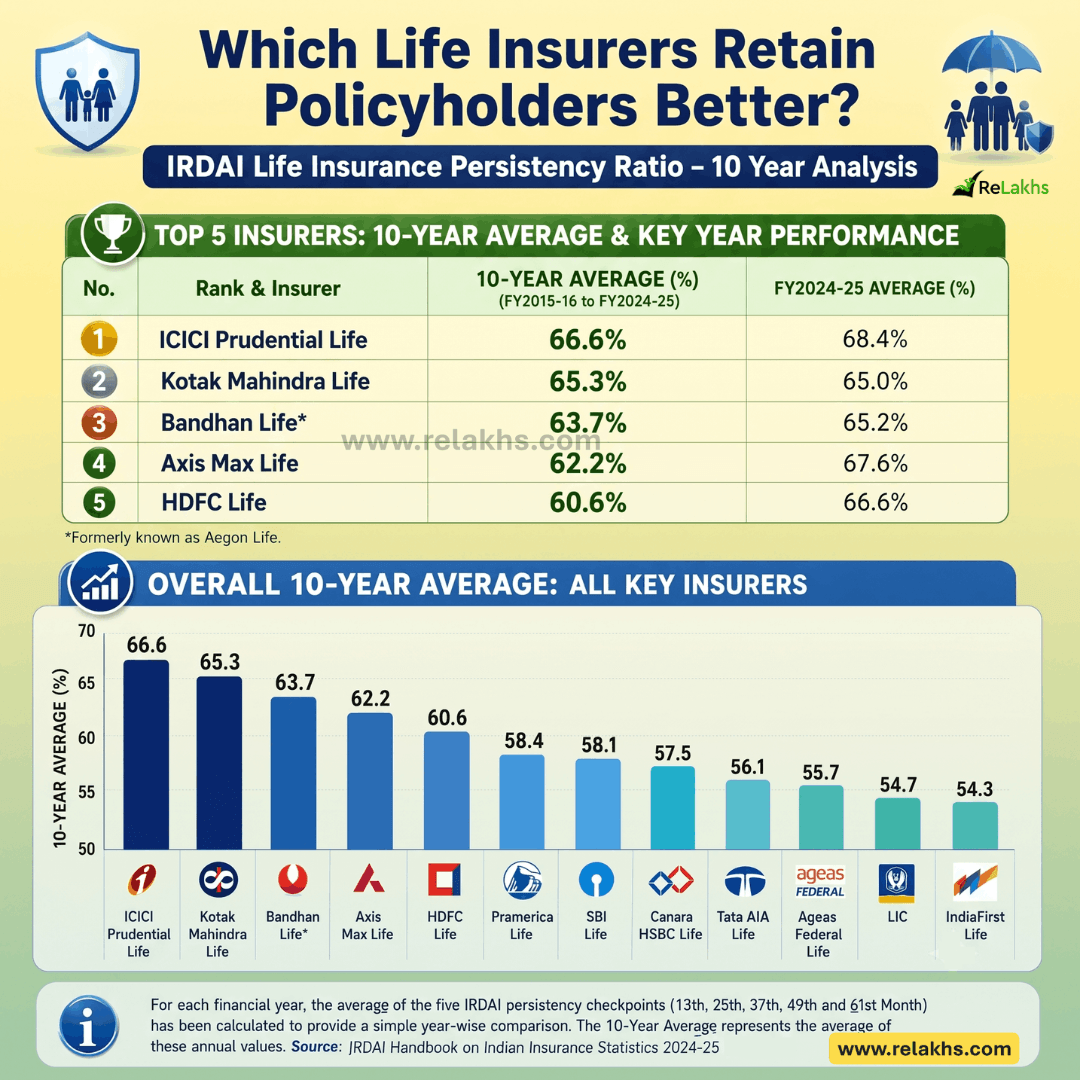
For each financial year, I calculated the average of the five persistency checkpoints (13th, 25th, 37th, 49th and 61st Month). The table below summarises the annual averages and the overall 10-year average for each insurer.
| Rank | Life Insurer | FY16 | FY17 | FY18 | FY19 | FY20 | FY21 | FY22 | FY23 | FY24 | FY25 | 10-Year Avg. |
| 1 | ICICI Prudential Life | 58.4 | 63.3 | 65.7 | 66.6 | 67.8 | 67.2 | 68.2 | 68.4 | 71.5 | 68.4 | 66.6 |
| 2 | Kotak Mahindra Life | 57.0 | 60.8 | 63.6 | 65.8 | 65.7 | 68.0 | 68.5 | 68.5 | 70.4 | 65.0 | 65.3 |
| 3 | Bandhan Life* | 51.3 | 54.4 | 59.8 | 62.2 | 63.4 | 68.4 | 71.3 | 72.0 | 69.0 | 65.2 | 63.7 |
| 4 | Axis Max Life | 55.0 | 58.8 | 60.6 | 61.8 | 63.8 | 61.4 | 62.2 | 64.2 | 67.0 | 67.6 | 62.2 |
| 5 | HDFC Life | 57.1 | 58.6 | 58.4 | 58.6 | 57.9 | 58.7 | 61.9 | 63.1 | 65.0 | 66.6 | 60.6 |
| 6 | Pramerica Life | 28.1 | 37.3 | 43.6 | 52.1 | 74.9 | 78.1 | 79.4 | 62.1 | 63.4 | 64.8 | 58.4 |
| 7 | SBI Life | 48.9 | 51.8 | 54.2 | 55.7 | 56.5 | 57.9 | 60.5 | 63.9 | 65.7 | 65.8 | 58.1 |
| 8 | Canara HSBC Life | 43.9 | 48.1 | 51.1 | 54.9 | 57.3 | 60.1 | 61.8 | 64.1 | 66.1 | 67.5 | 57.5 |
| 9 | Tata AIA Life | 40.1 | 43.3 | 46.6 | 51.1 | 55.8 | 56.1 | 61.4 | 66.0 | 69.2 | 71.1 | 56.1 |
| 10 | Ageas Federal Life | 56.4 | 54.1 | 54.3 | 57.2 | 55.9 | 58.1 | 54.4 | 53.8 | 54.9 | 57.5 | 55.7 |
| 11 | LIC | 52.4 | 53.0 | 54.6 | 56.2 | 52.2 | 56.0 | 56.0 | 55.8 | 55.8 | 55.0 | 54.7 |
| 12 | IndiaFirst Life | 47.1 | 49.2 | 50.0 | 50.5 | 52.6 | 53.3 | 63.0 | 64.1 | 57.2 | 55.9 | 54.3 |
Note: The 10-Year Persistency Analysis is an independent analysis based on official IRDAI data and is intended for educational purposes. It is not an official IRDAI ranking. * Bandhan Life includes the historical data of its predecessor entity as reflected in the IRDAI Handbook. Formerly known as Aegon Life.
For example, if an insurer has a 10-Year Average Persistency Ratio of 60%, it broadly indicates that, on average, around 60% of the eligible policyholders continued paying their renewal premiums across the five persistency checkpoints over the last decade, while the remaining policyholders discontinued their policies at different stages.
In general, a higher persistency ratio is considered better, as it suggests that a larger proportion of policyholders continued their policies over the long term.
Key Observations
A few interesting trends emerge from the 10-year analysis:
- Long-term consistency is more meaningful than a single year’s performance – An insurer may perform exceptionally well in one particular year, but analysing a decade of data provides a much better picture of long-term customer retention.
- ICICI Prudential and Kotak Mahindra Life have shown strong long-term consistency – Based on the 10-year average, these insurers have maintained relatively strong persistency over the last decade.
- Tata AIA has shown remarkable improvement – Although Tata AIA’s long-term average is lower than some peers because of its earlier years, its annual persistency averages have improved significantly in recent years, reaching 71.1% in FY2024-25.
- LIC has remained relatively stable – LIC’s annual averages have remained within a fairly narrow range over the last decade, indicating relatively stable customer retention despite its vast and diverse customer base.
- Persistency is only one piece of the puzzle – A higher persistency ratio should not be interpreted as a recommendation to buy a policy from a particular insurer. It is simply another parameter that can help you better understand long-term customer retention.
Should Persistency Ratio Influence Your Choice of Life Insurer?
Yes—but only as one of several factors. When comparing life insurance companies, also consider:
- Claim Settlement Ratio
- Solvency Ratio
- Product features
- Premium affordability
- Customer service
- Your financial goals
Think of the Persistency Ratio as an additional indicator rather than a final verdict.
Final Thoughts
The IRDAI Life Insurance Persistency Ratio offers valuable insight into how consistently policyholders continue their life insurance policies over time. Instead of focusing on a single year’s numbers, analyzing a decade of data helps identify broader trends and provides a more balanced perspective on customer retention.
As a prospective policyholder, use the Persistency Ratio alongside other important metrics such as the Claim Settlement Ratio, product suitability, and premium affordability before making your decision.
After all, the best life insurance policy isn’t just one that you buy—it’s one that you can comfortably continue until it achieves its intended purpose.
Continue reading:
- Latest Health Insurance Incurred Claim Ratio 2025 | Top Health Insurance Companies List
- LIC Policy Returns in 2026: How Much Do LIC Policies Really Return?
- What’s in a Name? The Hidden Truth About Children’s Insurance Plans
(Post first published on : 02-July-2026)
Disclaimer: The analysis and observations shared in this article are based on publicly available IRDAI data and are intended solely for educational purposes. Always evaluate multiple factors—including product suitability, Claim Settlement Ratio, Solvency Ratio, features, and your own financial needs—before choosing a life insurance policy or insurer.
Join our channels