Most mutual fund investors look at past returns first. Questions like “Which fund gave the highest 5-year return?”, “Which fund has the highest CAGR?”, or “Which fund has a 5-star rating?” come up all the time.
And yes, returns matter. But they are only one part of the picture.
Think of two equity mutual funds that both delivered 15% annual returns over the last five years. Fund A achieved that with relatively steady performance, while Fund B went through sharp ups and downs along the way. Most investors would naturally prefer Fund A, because it gave the same return with less stress.
That’s the real point: when it comes to investing, risk matters just as much as return.
Why Should You Look Beyond Returns?
Higher returns often come with higher risk. An equity mutual fund that tops the return charts during a bull market may also fall much more sharply during a market correction. If you chase the highest-returning fund without understanding the risk behind it, you could face unpleasant surprises when the market gets volatile.
That’s where risk and risk-adjusted return measures become useful. These tools help you understand:
- How much risk the fund is taking
- Whether the fund manager is adding real value
- How volatile the fund is compared to its peers
- How efficiently it converts risk into returns
Instead of looking only at returns, it’s better to evaluate returns in relation to the risks taken. That gives you a clearer picture of what you are really investing in.
Key Risk & Risk-Adjusted Return Measures for Equity Mutual Funds
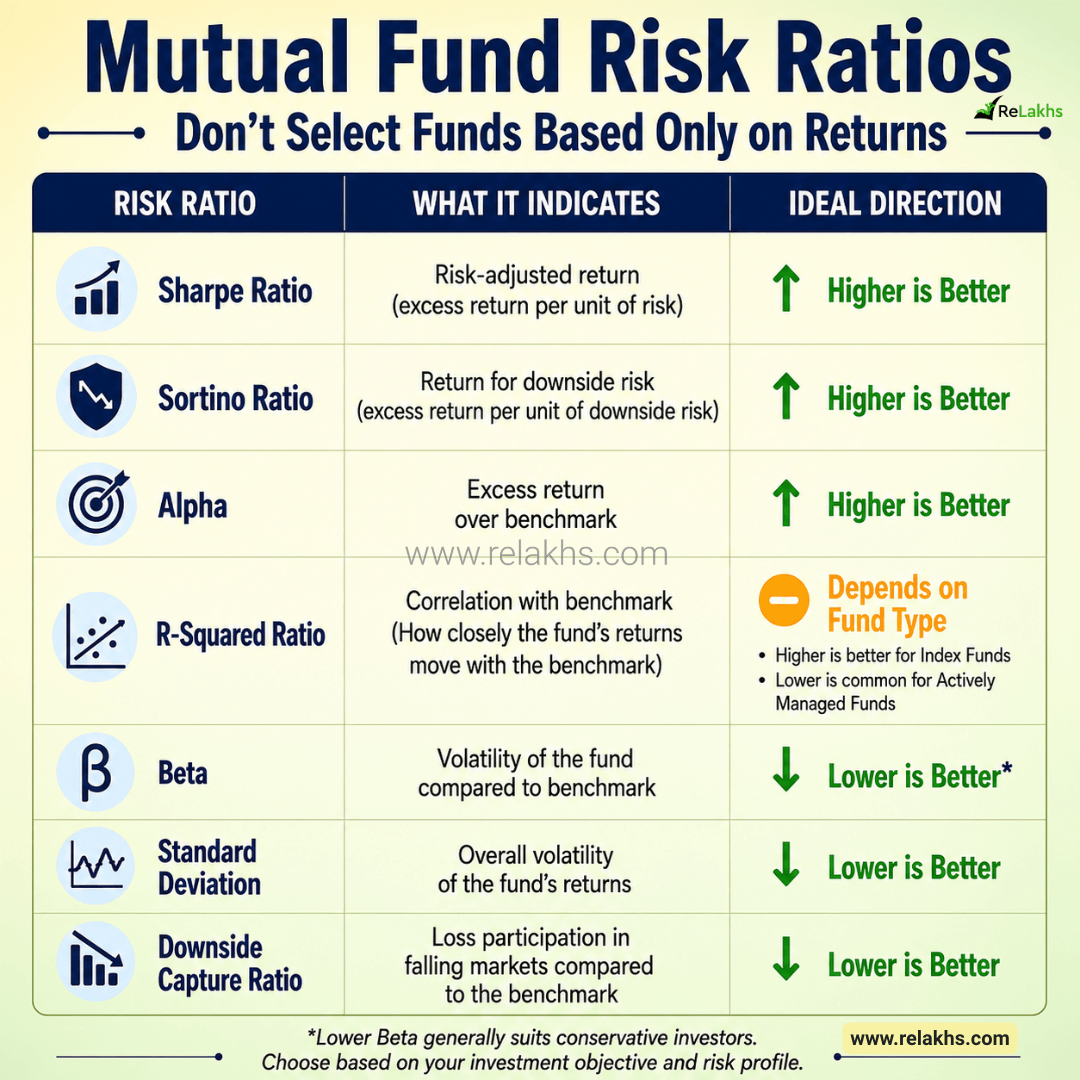
1. Sharpe Ratio
What is the Sharpe Ratio? The Sharpe Ratio tells you how much extra return a mutual fund gives you for every unit of total risk it takes. In simple terms, it answers the question: “Did the fund reward investors enough for the risk it took?”
How to interpret it
- Higher Sharpe Ratio = Better risk-adjusted performance
- Lower Sharpe Ratio = Less efficient (the fund is taking more risk for the same return)
Example: Suppose two funds both delivered 15% returns.
- Fund A: 15% return, Sharpe Ratio = 1.40
- Fund B: 15% return, Sharpe Ratio = 0.95
Even though returns are the same, Fund A is considered better because it generated those returns more efficiently, with less risk per unit of return.
2. Sortino Ratio
The Sortino Ratio is similar to the Sharpe Ratio, but with one key difference. Instead of considering all volatility, it focuses only on downside volatility. Investors usually don’t worry when prices rise sharply. What really matters is when investments fall. The Sortino Ratio is built to measure that harmful volatility.
How to interpret it
- Higher Sortino Ratio = Better
- A higher value means the fund generated strong returns while keeping downside risk low
In simple terms, the Sortino Ratio helps you see how well a fund protects your money during market drops, not just how much it grows when markets are upbeat.
3. Alpha
Alpha measures how well a fund manager can generate returns above the benchmark after adjusting for market movements. In simple terms, it asks: “Did the fund manager actually add value?”
How to interpret it
- Positive Alpha = Fund outperformed the benchmark
- Negative Alpha = Fund underperformed the benchmark
Example: If the benchmark returned 12% and the fund delivered 15%, the Alpha could be +3% after adjusting for market risk. A consistently positive Alpha usually shows good stock selection and portfolio management.
4. R-Squared (R²)
R-Squared measures how closely a mutual fund’s returns move in line with its benchmark index. Unlike other ratios, R-Squared is neither inherently good nor bad; its meaning depends on the type of fund.
For Index Funds – A high R-Squared (generally above 90) is desirable because the objective is to closely track the benchmark.
For Actively Managed Equity Funds – A lower R-Squared is perfectly normal. It simply shows that the fund manager is taking independent decisions rather than following the benchmark closely.
For actively managed funds, Alpha and Beta often matter more than R-Squared alone.
5. Beta
Beta measures how sensitive a mutual fund is to overall market movements.
How to interpret it
- Beta = 1 → Fund moves broadly in line with the market
- Beta > 1 → Fund is more volatile than the market
- Beta < 1 → Fund is less volatile than the market
Example: If a fund has a Beta of 1.20, it may rise about 12% when the market gains 10%. Similarly, if the market falls 10%, the fund may drop around 12%.
Investors with lower risk tolerance usually prefer funds with a relatively lower Beta, as they tend to be less volatile during market swings.
6. Standard Deviation
Standard Deviation measures the overall volatility of a mutual fund’s returns. A higher standard deviation means the fund’s returns fluctuate more. A lower standard deviation indicates relatively more stable performance.
Example: If two funds generate similar long-term returns, the one with a lower standard deviation will usually give you a smoother investment journey.
7. Downside Capture Ratio
This is one of the most underrated yet useful measures. The Downside Capture Ratio tells you how much a mutual fund falls compared to its benchmark during declining markets.
How to interpret it
- Lower ratio = Better downside protection
Example: Suppose the benchmark falls by 10%.
- Fund A falls by only 7%
- Fund B falls by 12%
Fund A has better downside protection. Protecting your capital when markets drop can significantly improve long-term wealth creation.
What About Upside Capture Ratio? While the Downside Capture Ratio measures performance during falling markets, the Upside Capture Ratio measures how much of the benchmark’s gains a fund captures during rising markets. Higher is generally better.
A strong equity mutual fund should aim to:
- Capture a large portion of market gains during bull markets (higher Upside Capture Ratio)
- Limit losses during market corrections (lower Downside Capture Ratio)
In simple terms, the ideal fund is one that rises more when markets go up and falls less when markets go down. While no fund can consistently do this across all market cycles, these two ratios together give valuable insights into a fund’s risk management and how it performs in different market conditions.
Where Can You Find These Mutual Fund Risk Ratios?
Understanding the ratios is only the first step. The next question is: “Where can I find these risk measures before investing?” There are several reliable places where these metrics are published.
1. Value Research
One of the most widely used mutual fund research websites in India. You can find Sharpe Ratio, Sortino Ratio, Alpha, Beta, Standard Deviation, R-Squared, portfolio details, historical returns, and risk grades. It also lets you compare multiple mutual funds within the same category, making it easier to shortlist suitable schemes.
2. Morningstar India
Morningstar offers comprehensive mutual fund analytics, including risk-adjusted performance measures, Alpha, Beta, Standard Deviation, Sharpe Ratio, portfolio composition, and fund manager details. Its reports also include detailed commentary and style analysis.
3. Mutual Fund Factsheets
Every Asset Management Company publishes a monthly factsheet for each scheme. These usually include fund performance, portfolio holdings, Standard Deviation, Beta, Sharpe Ratio, portfolio turnover, sector allocation, and market-cap allocation. If you already own a mutual fund, checking its monthly factsheet is a good habit.
4. Other Mutual Fund Research Portals
Several other financial websites and investment platforms also publish these risk measures and fund analytics.
Important note: The calculation period (1 year, 3 years, 5 years, etc.) may vary across platforms. So, whenever possible, compare funds using data from the same source.
Real-Life Example: Comparing Two Small Cap Funds
Let’s compare two well-known small cap funds to understand why investors should look beyond returns. Illustrative comparison only. The figures below are indicative and may change over time. Always refer to the latest factsheets before making investment decisions.
Here is the 5-year comparison data for SBI Small Cap Fund and Nippon India Small Cap Fund based on recent regular plan performance metrics:
| Metric | SBI Small Cap Fund | Nippon India Small Cap Fund | Better Interpretation |
| 5-Year Returns (CAGR) | ~14% | ~20% | Returns alone don’t tell the full story. |
| Sharpe Ratio | 0.41 to 0.45 | 0.68 to 0.76 | Higher is generally better (Risk-adjusted return). |
| Alpha | -3.97 to 4.06 | 0.54 to 1.36 | Higher is generally better (greater outperformance vs. benchmark) |
| Beta | 0.73 to 0.75 | 0.85 to 0.86 | Lower may suit conservative investors (lower market sensitivity) |
| Standard Deviation | 14.59% to 17.11% | 14.54% to 19.55% | Lower generally indicates lower volatility (Smoother ride). |
| Downside Capture | ~65% | ~68% | Lower indicates better downside protection during market declines. |
Returns & Alpha: Nippon India Small Cap has historically delivered higher Alpha and absolute returns over the 5-year period.
Volatility & Protection: SBI Small Cap, true to its reputation, maintains a lower Beta and Standard Deviation, indicating a more conservative stance relative to the broader small-cap swings. SBI consistently maintains a lower Beta (0.73 – 0.75) compared to Nippon (0.85 – 0.86). This is the classic trade-off: Nippon aggressively captures the upside, while SBI plays defensive.
A Few Practical Tips
These ratios are useful, but don’t pick a fund just because it has the highest Sharpe Ratio or the lowest Beta. Instead, look at the complete picture.
- Compare only funds within the same category.
- Prefer funds with at least a 5–10 year track record.
- Review multiple risk measures together, not just one ratio.
- Check whether the fund manager stayed the same during the evaluation period.
- Risk measures change over time, so review them periodically.
Remember, these ratios are decision-support tools—not decision-makers. They should complement your analysis of the fund’s investment objective, portfolio quality, consistency of returns, expense ratio, and suitability for your financial goals.
Investing is not about finding the fund with the highest returns—it’s about finding one that delivers consistent, risk-adjusted performance. Before investing in your next equity mutual fund, spend a few minutes reviewing these risk measures. They can help you make more informed investment decisions.
If you have any questions, feel free to leave a comment below.
Continue reading:.
- Best Mutual Funds for 2026: Picking “Consistency Kings” Over Performance
- My Latest Mutual Fund Portfolio 2025-26 | Strategy, Returns & Lessons Learned
(Post first published on : 29-June-2026)
Disclaimer: This article is intended solely for educational purposes. Mutual fund investments are subject to market risks, and past performance does not guarantee future returns. Risk ratios, returns and other statistics discussed in this article are dynamic and may change over time. The mutual fund examples are provided only to explain the concepts and should not be considered as buy, sell or investment recommendations. Always do your own research or consult a qualified financial advisor before making investment decisions.
Join our channels