You may have seen or noticed commercials of Mutual Fund Schemes that end with a standard disclaimer – ‘Mutual Fund investments are subject to Market Risk. Past performance may or may not be sustained in future. Past performance is not indicative of future returns.’
The two terms which are important here are ‘Returns’ & ‘Risk’ (or Volatility).
A mutual fund scheme invests in Equity and/or debt securities. These are the underlying assets of a mutual fund scheme. The returns generated by these securities can be VOLATILE.
So, when picking the right and best mutual fund scheme, it is advisable to
- To analyze the past performance of the funds (measure returns) & also
- To evaluate how VOLATILE these returns are? How consistent are the returns?
The volatility of returns generated by a mutual fund scheme can be measured by some important risk ratios like;
- Standard Deviation
- Beta
- Alpha
- Sharpe Ratio
- R-Squared Ratio
- Upside & Downside Ratios
Actually, these ratios are referred to as ‘measures of Risk’. But, they measure the volatility associated with a financial instrument. This volatility leads to RISK i.e., you may or may not get the desired returns to achieve your financial goal(s).
When short-listing the best mutual fund scheme, you can analyze the funds on four parameters;
- Compare the returns generated between Fund A and Fund B.
- Analyze and evaluate the volatility of returns between Fund A & Fund B based on measures of Risk.
- You can also compare returns of Fund A with the returns of its Benchmark index / Fund Category.
- You can evaluate the measures of Risk between Fund A with that of its Category or Benchmark index.
How to select the best Mutual Fund Scheme based on Measures of Risk/Volatility?
Let’s now discuss more details about these ratios and try to understand their importance when selecting the right and best mutual fund scheme. You need to give importance to both returns and measures of volatility while short listing mutual fund schemes.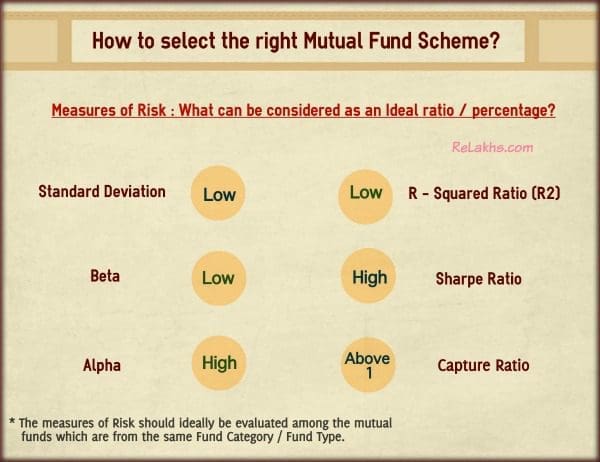
Standard Deviation
- Standard deviation for a mutual fund tells you how much variance there is in the fund’s returns.
- Based on SD you can analyze the consistency of returns generated by a mutual fund scheme.
- It’s useful in a long-term sense (longer time period).
- A Standard deviation of say 20 means that fund will generate plus or minus 20% from its long term average returns.
- If a fund has say a 12% average rate of return and a standard deviation of 4%, its return will range from 8-16%.
- Higher the Standard Deviation, higher the fluctuations in returns. So, you need to look out for a fund with a low Standard Deviation.
Beta
- Beta gives you an idea on the correlation between a fund’s performance and its Index.
- It tells you how much a fund’s performance would swing compared to a benchmark. (SEBI made it mandatory for fund houses to declare a benchmark index. For example: The benchmark index for HDFC Top 200 is S&P BSE 200.)
- High Beta or low Beta, which one is good? If you are a risk-averse investor, low Beta is good. High Beta does not mean the fund’s performance is better than its index. It just indicates that returns can be volatile (up or down) when compared to the fund’s benchmark index.
- If a mutual fund has Beta of 1 that means the performance of the fund will perfectly match the performance of its benchmark index.
- If a fund has a beta of 1.5, it means that for every 10% upside or downside, the fund’s NAV would be 15% in the respective direction.
- The Beta can be a negative figure too, which indicates that there is no correlation between the performance of fund and its benchmark index.
Alpha
- Alpha gives you an idea whether the fund has out-performed its benchmark index or not.
- It measures the fund’s performance (returns) and risk relative to its benchmark index.
- Alpha is measured as a percentage so an alpha of 10 means the fund outperformed its benchmark by 10%.
- So, ideally you would like a fund to have HIGH Alpha. Higher the Alpha the better.
R-Squared Ratio (R2)
- R-Squared measures the relationship between a portfolio and the Fund’s benchmark.
- Kindly note that it is not a measure of the performance of a portfolio. However, it measures the correlation of the Fund’s Portfolio’s returns to the Benchmark’s returns.
- Most of the Large cap & Index funds will have high R-Squared ratio.
Sharpe Ratio
- It measures the returns with respect to risk taken by the Fund. It is a risk-adjusted measure.
- A good Fund should be able to generate decent returns without taking too much risk.
- Ideally, a fund with high Sharpe Ratio is better. (Treynor ratio is similar to Sharpe Ratio.)
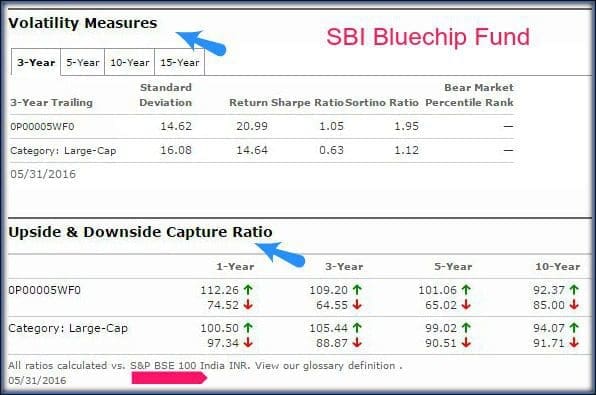
Upside & Downside Capture Ratios
- These ratios show us whether a given fund has outperformed i.e., gained more or lost less than the broad market benchmark during periods of market strength (bull phase o upside) and weakness (bear phase or downside), and if so, by how much.
- An upside capture ratio of over 100 indicates a fund has generally outperformed the benchmark during periods of positive returns for the benchmark. Meanwhile, a downside capture ratio of less than 100 indicates that a fund has lost less than its benchmark in periods when the benchmark has been in the red. (courtesy : mornigstar.com)
- Ideally, you would like a fund to have higher Upside capture ratio (>100) and lower downside capture ratio (<100). Lower the downside capture ratio, better the ‘DOWN-SIDE PROTECTION’.
- Some funds may give you the best returns when markets are UP but they do not necessarily go on to out-perform when the markets FALL. So, we need to identify the funds which outperform in both the scenarios. Identifying the funds that ‘lost the least when markets tanked’ should also be given importance.
- Capture ratio is calculated as Upside Ratio divided by Downside ratio. For example, a fund with an upside-capture ratio of 100% and a downside ratio of 80% would have an upside/downside ratio of 1.25. Any ratio above 1 means that a fund does a good job of capturing gains during bull phases while lessening the impact of bear markets.
There are certain other Risk ratios like;
- Sortino Ratio : It is a variation of Sharpe Ratio. It factors in only the downside or negative volatility.
- Omega Ratio : The Omega ratio is a relative measure of the likelihood (probability) of achieving a given return, such as a minimum acceptable return or a target return.
Where to get information on important Measures of Risk Ratios?
Where to find the values of these Risk Ratios? Are there any online portals which provide details on these measures of risk?
Yes, the details are readily available on portals like Valueresearchonline & Morningstar.
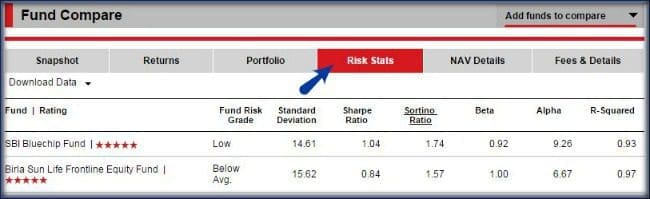
How to Compare Mutual Funds Performances based on Risk Ratios? (Fund A Vs Fund B)
- Visit Valueresearchonline portal and click on ‘Fund Compare‘. Let’s compare two Large Cap oriented Funds – i) SBI Bluechip Fund & ii) Birla Sunlife Frontline Equity Fund. (Read : What are Large / Mid / Small Cap Fund Categories?)


- You may click on ‘Returns’ tab to analyze the Funds’ performances.


- You may click on ‘Risk Stats’ tab to evaluate the performances of these funds on various Risk ratios.
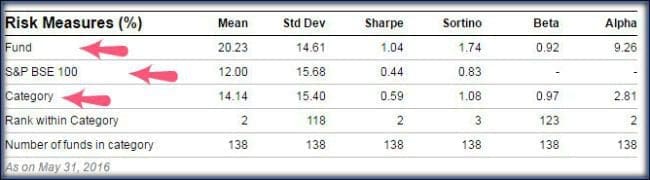
Fund A Vs Benchmark Index Vs Fund Category
- Click on any individual Mutual Fund Scheme link and you can find details about risk ratios related to that specific Fund, its Benchmark Index and also of Fund Category in the same table. Below details are for SBI Blue Chip Fund Vs S&P BSE 100 (its benchmark index) Vs Category (Large-cap).

You may also find risk ratios’ details in Morningstar portal.
- Visit Morningstar.in portal and click on ‘Tools‘ menu option.

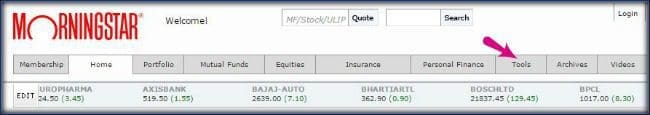
- You may click on ‘Fund Risk Measures’ to know the details of Risk ratios of a Fund. You can click on ‘Category Risk Measures’ to evaluate the category wise measures of volatility.


- Below details are for SBI Bluechip Fund (Click on ‘Fund Risk Measures’) (Morningstar provides information on Capture ratios, but the benchmark index for all the comparisons is S&P BSE 100)

Conclusion:
Performance (Returns) is not everything. If a fund generates high and abnormal returns but takes too much risk (unwarranted) then the returns may plummet (or) the performance may not be consistent. So, as a mutual fund investor you would like to invest in a product which balances risk and returns.
It is prudent to analyze both returns and risk ratios before shortlisting the best Mutual Fund Schemes.
Do you evaluate your MF Schemes based on these measures of Volatility? Kindly share your views and comments. Cheers!
Continue reading :
(Image courtesy of Stuart Miles at FreeDigitalPhotos.net. References : Valueresearchonline, morningstar & Freefincal.com) (Post Published on : 23-June-2016)
Sir,
Excellent job.Your blog is great help for beginners like me. No one like money control . etc. offer such detailed explanations. thanks for your efforts. Kindly review my SIP’s of 2000 each.
Kotak Select Focus Fund – Direct Plan – Growth –
Mirae Asset Emerging Bluechip Fund-Direct Plan – Growth
Motilal oswal multicap 35-regular growth
ICICI pru blue chip – direct growth
HDFC Small Cap – Direct growth
In addition to above i have invested in the following Regular MFs but now no sip in these and I want to reduce no. of funds.
1. ICICI Pru Eqty and Debt
2. ABSL Eqty advantage
3. HDFC equity Fund Growth
4. IDFC Premier Eqty Fund Growth
5. SBI Smalll Cap Growth
6. Sundaram Select Mid cap Growth
7. ABSL Focussed Eqty Growth
8. Axis Blue Chip Growth
9. DSP Blackrock Tax Saver Growth
10. HDFC Tax Saver Growth
11. Franklin india tax shield Growth
Kindly let me know to review my SIPs and guide for me to reduce no. Funds.
Dear Hanuman,
Thank you for your appreciation!
Any specific reason for investing in so many MF schemes? May I know your investment objective(s) and time-horizon?
Thanks, there was no specific reason as these were got accumulated and couldn’t switch over. Time horizon is for minimum 10-12 year. Please guide
Dear Hanuman,
Investing in too many funds may not be really beneficial, especially if they are from same fund category.
Ex : You have two large cap oriented funds, Axis Bluechip and ICICI Bluechip fund.
The overlap between these funds’ portfolios is around 40%. So, instead of investing in two large cap funds, you can retain only one.
Same is the case with mutlicap, small cap and mid-cap ones.
Suggest you to go through below articles and revert with your analysis;
* Mutual Fund Portfolio Overlap Comparison Tools
* What are Mutual Fund Upside / Downside Capture Ratios? | How to use them in MF Performance Analysis?
Thanks again. I have gone through these articles. Kindly let me know whether the 5 funds in which my sip is continuing are ok or not.
Secondly I want to switch over from balance funds, how to go abt it.
Please guide
Dear Hanuman,
They look fine, you may continue with your SIPs.
Thanks, please guide me for the following.
I have one multi cap ( Kotak) and one large cap fund ( ICICI). Which one to discontinue.
Also how and in which funds should I go for the redemption of following funds in which there is no sip since 1 year.
1. ICICI Pru Eqty and Debt
2. ABSL Eqty advantage
3. HDFC equity Fund Growth
4. IDFC Premier Eqty Fund Growth
5. SBI Smalll Cap Growth
6. Sundaram Select Mid cap Growth
7. ABSL Focussed Eqty Growth
8. Axis Blue Chip Growth
9. DSP Blackrock Tax Saver Growth
10. HDFC Tax Saver Growth
11. Franklin india tax shield Growth
Thanks
Dear Hanuman,
1 – You may continue both, multi-cap and large-cap.
2 – Funds 2, 3, 5, 6, 8,10 can be redeemed and re-invested in your active SIPs.
9 & 10 are ok ones.
Thanks a lot again.
Just a little doubt
1. even ICICI PRU BLUE CHIP AND KOTAK MULTI CAP ARE HAVING abt 40% overlap, should I continue both.
2. When should I redeem. Wait for some gain or now
Please guide
Thanks
Dear Hanuman,
Most of the multi-caps have currently higher allocation to large-cap stocks, due to the current market condition.
Kotak multi-cap fund is a good one and the fund manager may alter the allocation %s among large, mid and small-caps anytime in the future based on the prevailing markets..
2 – The near-term future looks ‘not that great’ for the equity. You may be better off to switch from these funds to better ones at these lower levels.
thanks a lot.
Should i evenly distribute as lump sum among following MFs in which SIP is continuing or in a staggering manner with varying proportions.
Kotak Select Focus Fund – Direct Plan – Growth –
Franklin India Prima Fund- Dir Growth
ICICI pru blue chip – direct growth
SBI Small Cap – Direct growth
thanks
Dear hanuman,
You may have higher allocation to Multi-cap fund and Large cap fund and slightly lower allocation to mid/small cap funds.
Hello Srikanth Sir
I m 38year old. I would like your suggestions on my MF portfolio.
SBI Bluechip Direct Growth Rs 5000 SIP monthly
L&T Infrastructure Direct Growth Rs5000 SIP Monthly
Principal Emerging Bluechip Direct Growth Lumsum Rs100000 & Rs5000 SIP monthly
L&T midcap Direct Growth, Lumsum Rs100000
planning to start SIP Rs1000
Reliance Multicap Fund Direct Growth Lumsum Rs200000
Planning to start SIP Rs2000
Plz suggest me is it right way?
My goal is to growth Rs3 caror in 20years…
Thanks
Dear Yatin,
Reliance multi-cap has not been performing well.
You have a large cap and a mid-cap fund, hence a large+mid-cap oriented fund like Principal EBC may not be really beneficial.. kindly re-check..
Related articles :
* Mutual Fund Portfolio Overlap Comparison Tools
* Top Mutual Fund Schemes to invest in 2019 | Best Equity Funds for Long-Term
* Retirement Planning in 3 Easy steps
Maan gaye Sirji!!! Sir I have active (currently live) investments in MF schemes from 2011! From where can I get “historical NAV” data? The AMFI site does allow download of such data (say in XL file). I have been misguided by local consultants. Please oblige by providing the needed instructions.
Dear Sanjay,
Kindly go through this article..