Just a few days back, the RBI has released the eighteenth volume of its annual statistical publication, ‘Handbook of Statistics on the Indian Economy – 2016.’ Through this publication, the Reserve Bank has been providing time series data on various economic and financial indicators for the Indian economy.
You can find lot of useful data related to;
- Macro Economic indicators
- Money & Banking
- Financial Markets
- Public Finances
- Trade & Balance of payments
- Socio & Economic indicators
Like in 2014 and 2015, this year also I have tried to collate some important / interesting points and trends related to Personal Finances like – Financial Savings of Households, total investments in bank deposits, investments in shares & mutual funds, information on total bank loans, performance of Share markets, Inflation data, NRI deposits etc.,
Before discussing the facts & figures, let us understand – what are households’ savings, Financial Assets and Physical Assets?
Households’ Savings correspond to the total income saved by households during a certain period of time. Savings and investments in banks, stock markets, Post office schemes, company deposits etc., are considered as Financial Assets / Financial Savings. Investments in properties (real estate), gold, silver etc., are Physical Savings / Physical Assets.
RBI’s statistical Data on the Indian Economy (2016)
Financial Assets Vs Physical Assets – Where do Indians save?
- From 1990 to 2000, Indian households preferred to invest in Financial assets to Physical assets.
- From 2000 to 2007, more savings were routed to Physical assets.
- Interestingly in 2007/08, more investments were made in Financial assets. This shows that retails/small investors participated in stock markets when their valuations were at peak. The markets eventually crashed in 2008.
- From 2008 to till date, we prefer physical savings to financial savings.
- The Financial Savings during 2014-15 were Rs 12,502 billion. This is an increase of around 7% when compared to financial savings of 2013-14.
- The savings in Physical Assets were Rs 13,794 billion during 2014-15. There is a decrease of 6%.
- So, 2014-15 data on financial savings also reveal the fact that Indians are investing major portion of their savings in Physical assets only. But there is a gradual increase in financial savings and a gradual decrease in the growth of physical savings year-on-year. It’s evident that the gap between these two is shrinking.
Financial Assets of the Households (2012- 2016)
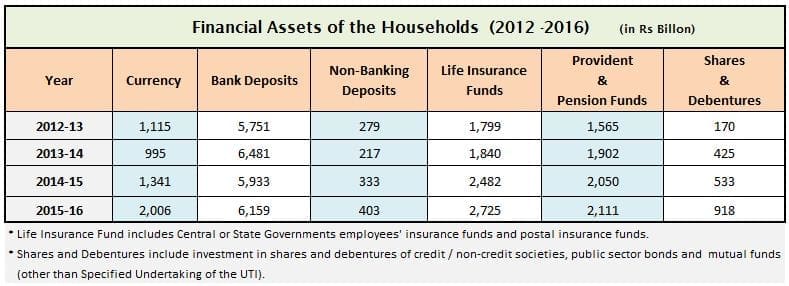
- You can notice that there is an increase of savings/investments in all the popular investment avenues.
- During 2015-16, a significant increase of investments in Shares & Debentures can be noticed.
Financial Liabilities:
- Around Rs 2,605 billion were taken as Loans and advances from the Banks during 2014-15. This figure is around Rs 3,544 for the FY 2015-16.
- Loans taken from other Financial institutions (NBFCs) during 2014-15 & 2015-16 were Rs 591 billion and Rs 657 billion respectively.
- The total financial liabilities of the households have increased from Rs 3,204 billion (in 2015) to Rs 4,212 billion (in 2016).
Bank Fixed Deposits with Scheduled Commercial Banks (March 2015)
- Term deposits: The below table gives you an idea about the total outstanding amount (as on Mar 2016) saved in Bank Term Deposits based on the tenure of the deposits. Term deposits with 1 to 2 year duration were the most preferred ones, followed by the Five year term deposits. (Read : ‘Avoid making long-term investments in FDs / RDs / Traditional life insurance plans.‘)

- NBFC deposits : The total public deposits collected by NBFCs (Non-Banking Financial Companies) were Rs 289 billion and Rs 356 billion in 2014-15 an 2015-16 respectively.
- NRI deposits : The total outstanding NRI deposits were Rs 8,419 billion, out of which NRE deposits, FCNR and NRO deposits were around Rs 4,740 billion, Rs 3,005 billion & Rs 672 billion respectively. (NRE – Non-resident (external) Rupee accounts, FCNR – Foreign currency non-resident & NRO – Non-Resident Ordinary Rupee Accounts)

Average Interest Rates on Bank Deposits (2012 to 2016)
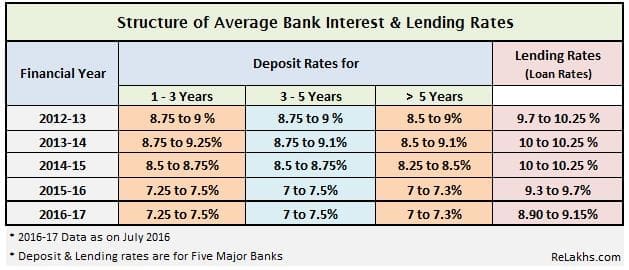
The above data confirms that interest rate cycle is in downward trend. All the top banks have reduced their Prime Lending Rates & deposit rates. We may expect further rate cuts (deposits & lending) in the next couple of years too. (Read : ‘What is new base rate system – MCLR?‘)
Post office Small Savings Schemes (SSS)

- Indian households’ savings in Post office time deposits and recurring deposits have increased in 2015.
- However, there has been a decline in investments in NSCs, KVP certificates and other popular schemes like Senior Citizen Savings Schemes or Monthly Income Scheme (MIS). (Read: ‘Latest Interest rates on Post office Small Savings Schemes 2016-2017‘)
- There has been a steady increase in long-term savings in Public Provident Fund scheme (PPF).
Gold & Silver
- Gold & silver to the tune of Rs 2,106 billion and Rs 276 billion was imported during FY 2014-15.
- Gold & silver to the tune of Rs 2,068 billion and Rs 244 billion was imported during FY 2015-16.
- The average price of Gold (10 gms) in 2015-16 was Rs 26,534 and silver (1 kg) was Rs 36.318.
Mutual Fund Schemes : Assets Under Management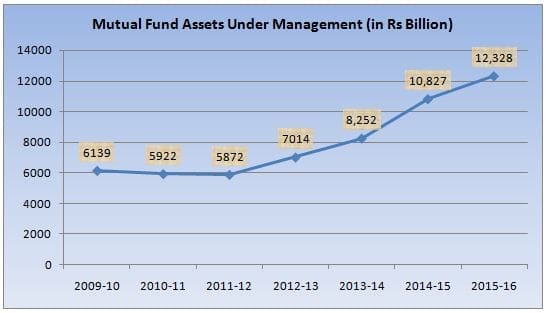
There has been a steady increase in Mutual funds’ AUM since 2011-12. The private sector Mutual Funds have mobilized around Rs 875 billion AUM. Whereas, the bank/financial institution sponsored and UTI have collected an AUM of around Rs 440 billion.
Other notable observations
- Tax Free Bonds : During the financial year 2015-16, Tax-free Bonds to the tune of Rs 435 billion were issued.
- Share Market Indices: The annual average of share price index of BSE Sensex was 26,332 and Nifty was 7,983 for FY 2015-16.
- Inflation : The CPI (consumer Price Index), which is popularly known as INFLATION has gradually decreased from 10 in 2012-13 to 4.9 in 2015-16.
- CRR & Repo Rates : During 2015-16, the RBI has reduced key policy rates like Repo Rate & Statutory Liquidity ratio. It has increased the Reverse repo rate and kept the Cash Reserve Ratio unchanged. The latest rates are – CRR @ 4%, SLR @ 21%, Repo rate @ 6.50% and Reverse-repo rate @ 6%. (Read : ‘What is CRR/SLR/Repo rate?‘)
- Agricultural Production (food grains) : The total agricultural production stood at 252 million tonnes in FY 2015-16. This is same as in 2014-15.
- Investments by LIC : LIC has invested around Rs 18,911 billion in Stock-exchange securities (an increase of around 13%).
- Home loans : HDFC has disbursed home loans to the tune of Rs 1,103 billion in FY 2015-16. The total home loan outstanding amount with HDFC is around Rs 2,592 billion.
- Cheque clearances : The total no of cheques cleared in 2015-16 were 1,096 million.The total amount cleared through cheques was Rs 81,860 billion (a decrease of around 4.5%).
I hope this post is useful and informative. Do you believe that the above data indicates a shift in the saving pattern of Indian households? How do you save and invest your money? Kindly share your views and thoughts. Thank you!
(Image courtesy of Stuart Miles at FreeDigitalPhotos.net) (Reference : RBI’s Handbook of Statistics on the Indian Economy. 2015-16 data is based on preliminary estimates) (Post published on : 19-September-2016)
Good info!
Hi sreekanth,
I am was working in SEO but now jobless. Can i do best in real estate sales in Delhi NCR ? I am not too good in ENGLISH communication.
Hi Sreekanth,
Is there any investment plan for lower categories people have pay scale below 2k p.a?
Dear Bharat ..Is it Rs 2,000 per year?
Sorry its 200000 per year. but with that there are regular expenses are also included in it. so what will be the best investment plan
Dear Sir,
Can you please explain
*how changes in oil prices affects the economy and the banking sector?
*Money laundering
*Basel norms
*Your opinion on how NPA’s can be controlled by banks
DearMr.Srikanth
I am a senior citizen and I have Rs 10lakhs to invest.Presently Senior citizen saving scheme of the Govt offers better interest rate as compared to other schemes and the tenure is 5years and the present interest rates will continue for the entire term.My LIC agent says that Interest rates will be coming down in future according to world trends
and therefore investing in Jeevan Akshay v1 of LIC is a better option.What is your considered opinion Sir.
Dear bharat ji,
Personally, I do not like to invest in a Pension plan due to liquidity factor, annuity is taxable, no transparency, low annuity rates etc.,
Advisable to invest in other options like the one you have mentioned Sr.C.S.S or MIS.
Read:
List of investment options.
Dear Shrikant i am not agree with your above opinion. Your study in all categaries is appreciatble. But i think you should reply with proper study.
Dear RAHUL ..I am ever-ready to study/learn.
Kindly let me know what is wrong in my above comment and why do you think Annuities are better??
YOUR LIC AGENT IS RIGHT SIR….
Awesome! Its genuinely remarkable piece of writing, I have got much clear idea on the topic of from this article.
Sir ,
My goal is to have a corpus of 3 cr by age of 50..curently am 29,unmarried..
i invest Rs 10k/ month for last 1 year in Sips & have invested 25k each in MF lumpsum this month .With 2016 coming to a close and foreign exchange reserves getting an alltime high ,should i invest more in lumpsum by year end or keep increasing Sip / month ?
Dear RANOBIR,
As you are investing for a long-term goal, kindly do not worry too much about foreign exchange reserves or any other micro/macro economic data. Just keep investing as and when its possible to you!
Read:
Retirement goal planning & calculator.
Financial planning pyramid.
A very informative post i must say as this contains most of the data i have been searching all over the internet from past few days. RBI savings data plays most crucial role when it comes to the Indian economy and this data must have been computed using many sensitive algorithms and i’m really thankful for the post as it surely going to help me in my up coming commerce exam. I expect many more posts and informative articles like this from you.
Have a good day.
Dear Rajkumar ..Thank you for your appreciation. Keep visiting!